A simplified procedure to do time series forecasting comprises 3 main steps:
- data assessment and preparation (discussed in the previous article <link>),
- prediction calculation,
- prediction assessment.
To achieve this, we need a metric to measure the accuracy of our forecasts. Without this measurement, we cannot determine the reliability of our predictions—and using unreliable forecasts for planning poses risks a planner would like to avoid.
This is also an issue with model choice for forecasting. To choose the best one you can base on the statistical features and their compatibility with the model (more about that in the next article), but to find out if it works you need to test it and properly assess the result – in other words, you need an evidence that the model is good to make an appropriate decision.
So, how to ensure appropriate accuracy measures? In this article, I will describe the usual metrics used to assess a forecast. I will also introduce our custom method – BiModal Prediction Score.
Common forecast accuracy metrics and formulas
Forecast accuracy is a factor based on which we choose the right model for a given time series. Choosing the right metrics is key to the whole process. Below, I present the most relatable metrics we can use to assess prediction.
Legend:
- yi– prediction value
- xi – true value
- n – number of forecasted periods
- T – number of periods in training set
- h - the training sample
- Scale-independent – good to compare different forecasts
- Direction of deviation – the information if the forecasts are over-or underestimated.

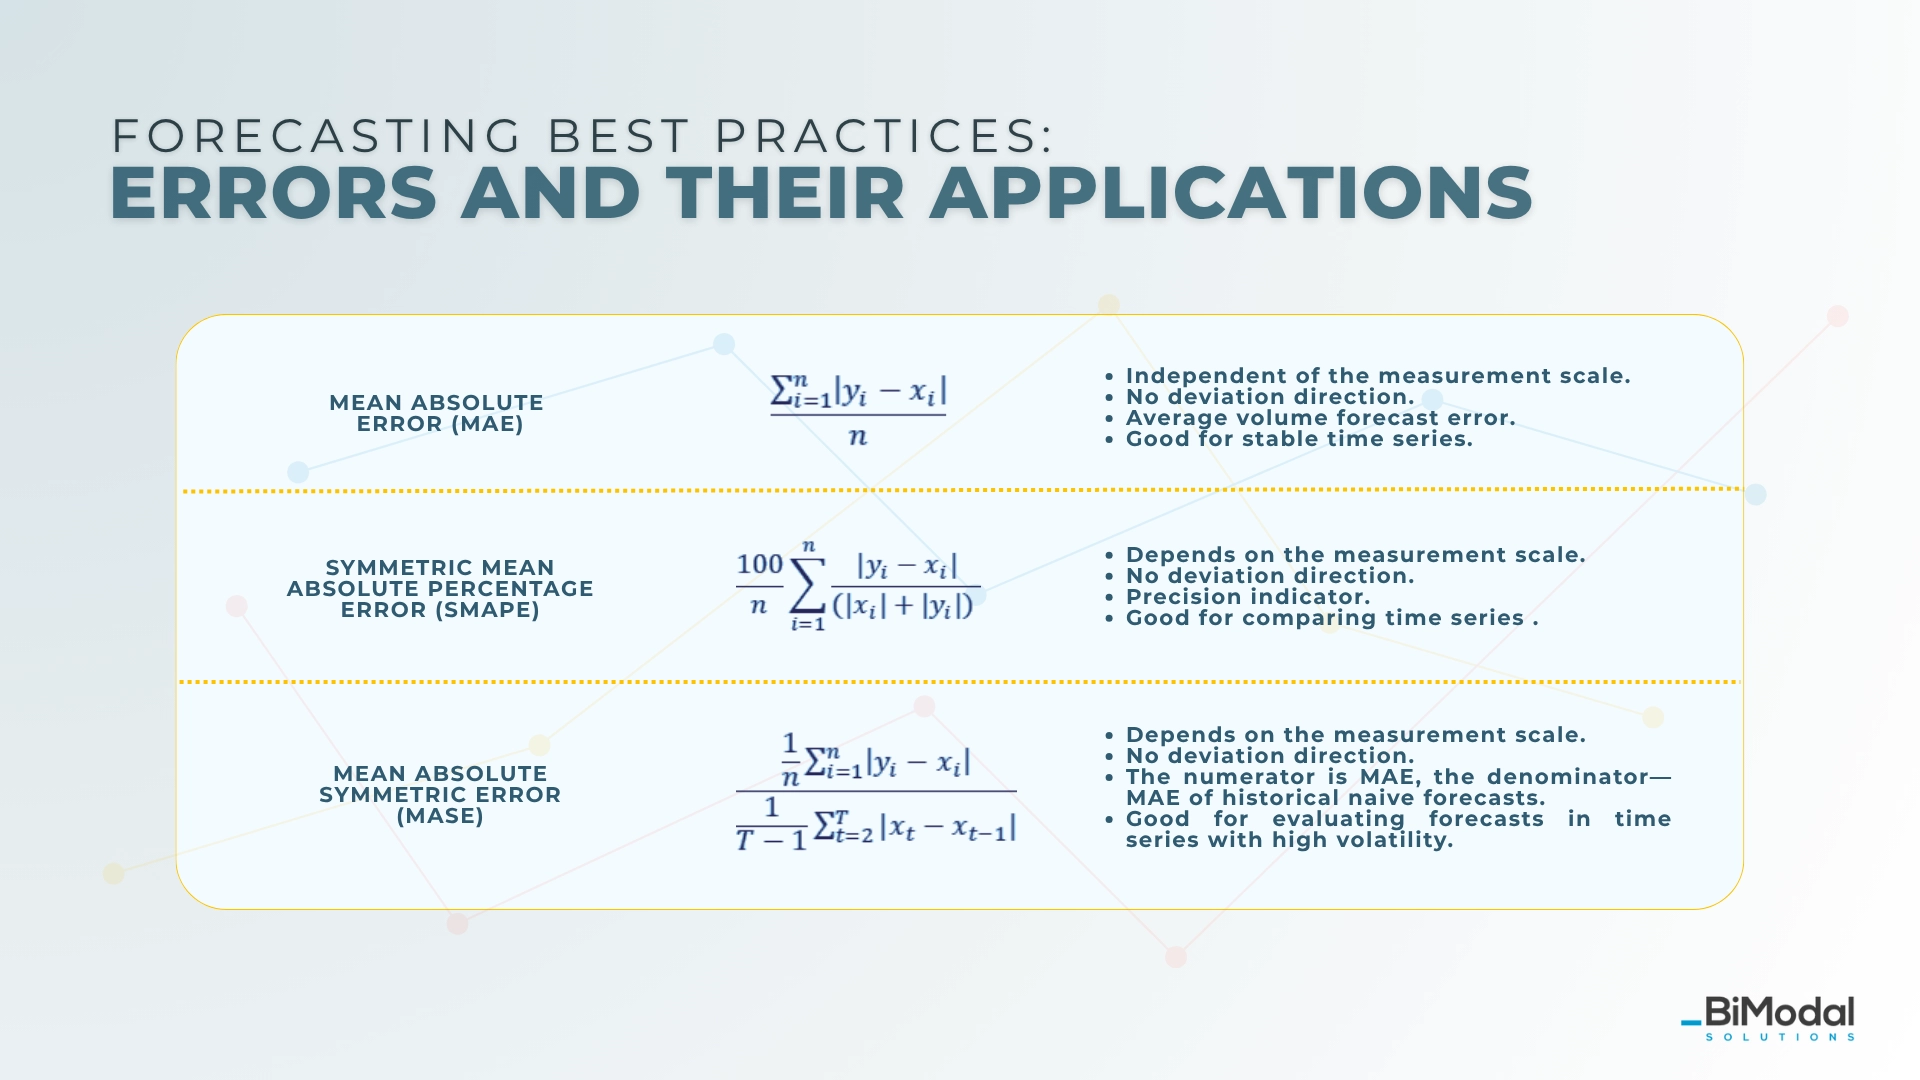
1. Mean absolute error (MAE)
Equation:

- Scale-independent: no
- Direction of deviation: no
- Remarks and recommendations: average volume error, good for stable time series.
MAE quantifies the average absolute difference between predicted values and actual outcomes [1].
2. Symmetric Mean Absolute Percentage Error (SMAPE)
Equation:

- Scale-independent: yes
- Direction of deviation: no
- Remarks and recommendations: precision indicator, good for comparison between time series.
The "symmetric" aspect means it treats over-predictions and under-predictions equally by dividing by the average of actual and forecast values (instead of just the values themselves) [1].[GU1]
3. Mean Absolute Scale Error (MASE)
Equation:

- Scale-independent: yes
- Direction of deviation: no
Remarks and recommendations: nominator is MAE of a forecast, denominator is MAE of naive forecast, good for time series with high variabilityIt was proposed by Hyndman and Koehler [2] as a more robust and comparable alternative to metrics like MAPE and MAE.

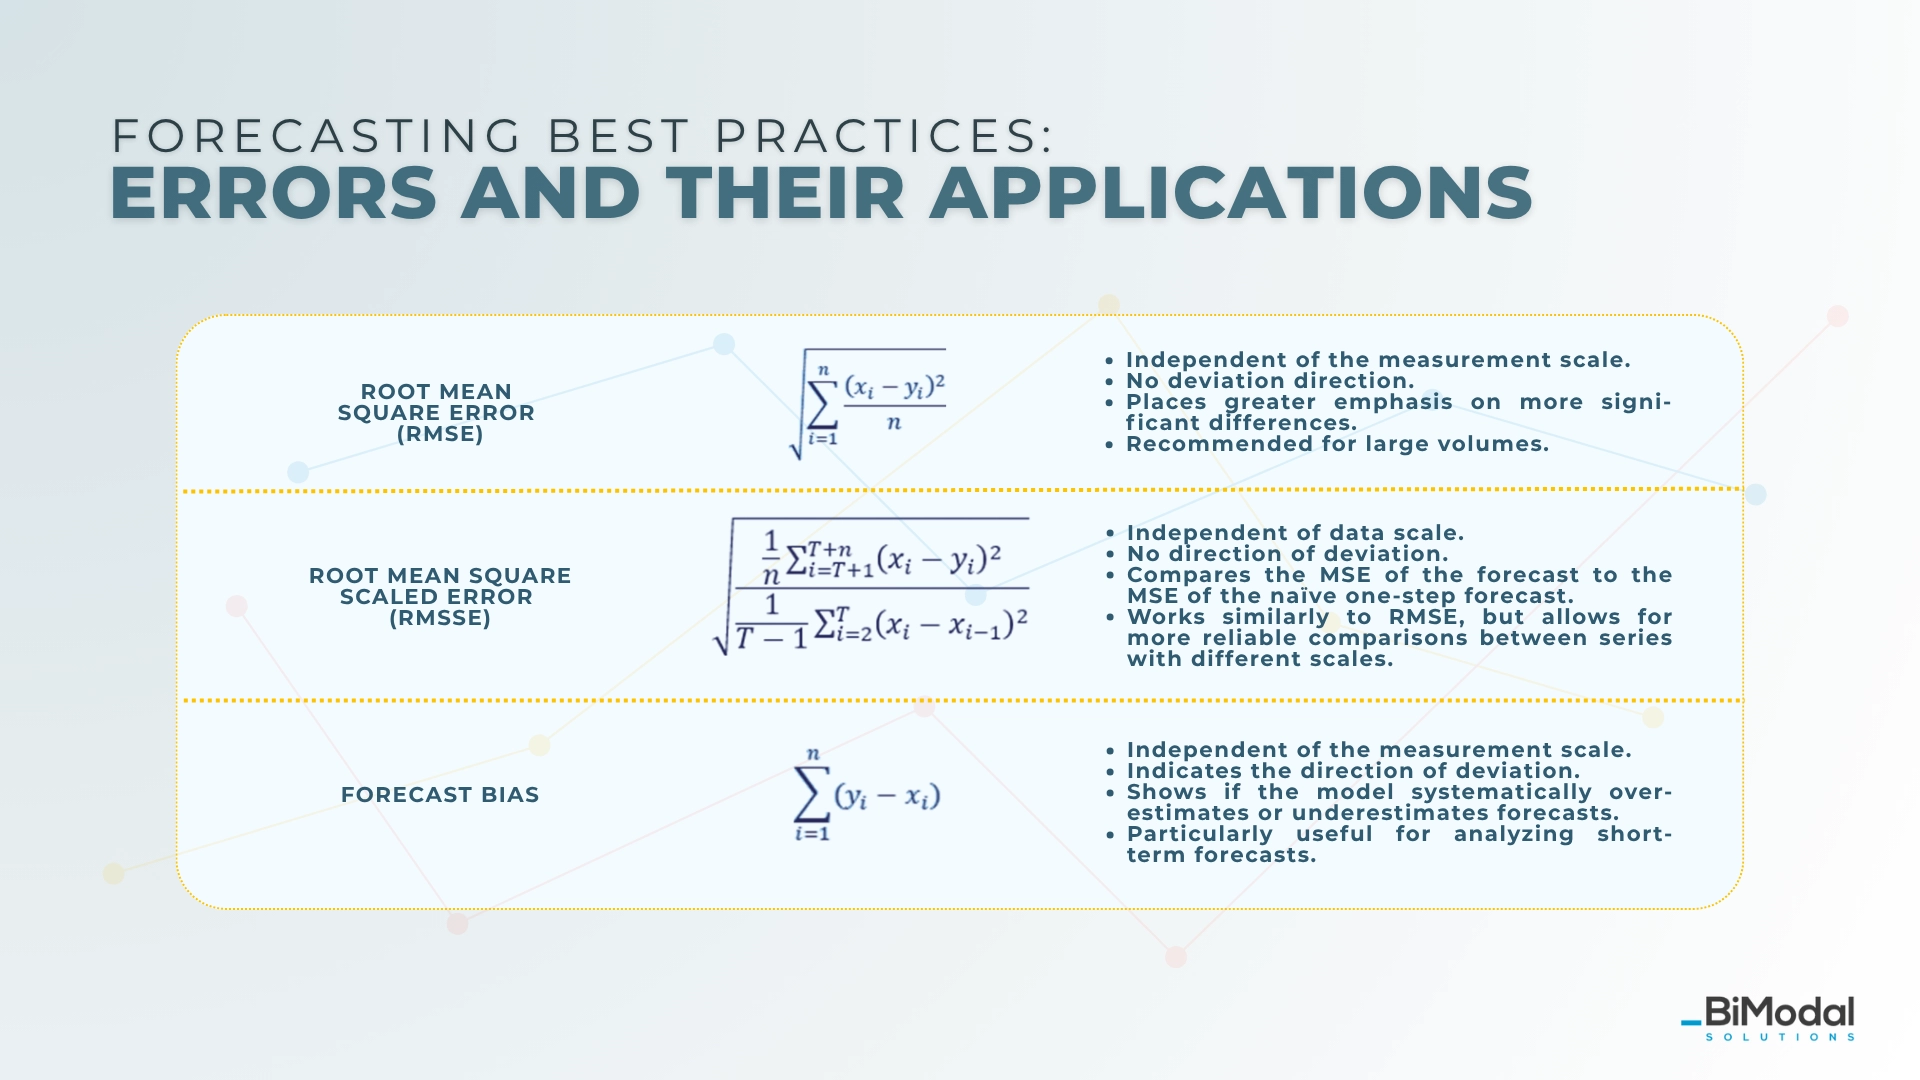
4. Root Mean Square Error (RMSE)
Equation:

- Scale-independent: yes
- Direction of deviation: no
- Remarks and recommendations: more importance is given to the larger differences, recommended for high-value products
RMSE is a measure of the average magnitude of the errors between predicted/forecasted values and actual observed values. It gives higher weight to large errors because errors are squared before averaging, making it sensitive to outliers [1].
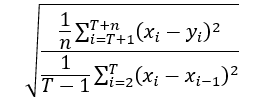
5. Root Mean Squared Scaled Error (RMSSE)
Equation:

- Scale-independent: yes
- Direction of deviation: no
- Remarks and recommendations: compares the MSE of the forecast to the MSE of a one-step naive forecast; similar to RMSE, but appropriately scaled
Uses squared errors and their root to strongly penalize large forecast mistakes and provide a more robust comparison across series of different scales [3].
6. Forecast Bias
Equation:

- Scale-independent: no
- Direction of deviation: yes
- Remarks and recommendations: indicates if the prediction in general is too high or too low, good to assess short-term predictions
Forecast bias reflects the systematic error in predictions, indicating the direction of the error rather than just its magnitude [1].
There's a high chance you have encountered such a summary. In addition to the numerical forecast errors, I would also like to include two more qualitative ones, which can also be quantified.
Forecast evaluation and statistical compatibility
If the forecast seems to be incompatible with the historical data, it signals that something could go wrong in the process. Such incompatibility can significantly differ from the average of the forecast if the data are without a significant trend. These things may happen when too simple models are used or data are influenced significantly by explanatory variables. This is a sign to use multivariate forecasting.
Forecast errors and prediction intervals
If the resulting intervals are too wide, you can qualify the forecast to a different method. Prediction intervals are calculated based on residuals from the test set, so you can also use simply MAE or bias at the testing stage. Assessment of prediction intervals happens at the very end of the process.
Measuring forecast accuracy: which method to choose?
In general, this decision is not an easy one. There are different goals to pursue, and each is better suited for specific purposes. This is why there is no perfect metric that works for everything, as perfection or ideal solutions do not exist in principle.
The same applies to models for time series data; there is no one-size-fits-all model. However, when it comes to choosing a model, we have options. Different models can be employed, as they all ultimately aim to achieve the same outcome: making predictions.
Measuring forecast accuracy: my recommendation
On the other hand, the accuracy metric should be universal, as it facilitates the comparison of the values between different time series. At the same time, it should bring proper meaning to the gathered data. Due to that, the choice of one metric is difficult at best; personally, I believe it to be an impossible endeavor.
So, the most plausible way to ensure that the measurement brings valuable insights is to focus on more than one goal, and create a score incorporating both appropriate accuracy indicators and business relevance (currently, the trend is to combine the forecast bias and MAE formulas).
Evaluating forecast accuracy with BiModal Forecasting
As we recognize the advantages of combining accuracy metrics and business context, we have developed the BiModal Prediction Score.
This score includes:
- the Symmetric Mean Absolute Percentage Error (SMAPE),
- a statistical compatibility assessment,
- and a factor for the width of prediction intervals.
We intentionally do not include bias, as it can create a misleading impression of accuracy in long-term forecasts—the positive and negative deviations can offset each other.
This approach works fairly well for short-term forecasts. Over a three-month period, if overestimations and underestimations balance out, your forecast remains stable. Conversely, using this method for long-term forecasts can be beneficial if applied in specific time buckets.
A guide on demand forecast assessment: the conclusion
Each error has some flaws – therefore, we should use hybrids to ensure accuracy and business relevance. This, along with the knowledge of the data features, will ensure that the correct model is chosen. The result will be the elimination of both the principal and statistical errors, and—on the other hand—meeting the high accuracy of your predictions.
The next post will touch upon some of the most popular forecasting models. Let's stay in touch!
Works Cited:
[1] Makridakis, S., Wheelwright, S. C., & Hyndman, R. J. (1998). Forecasting: methods and applications (3rd ed.). Wiley, 40-45
[2] Hyndman, R. J., & Koehler, A. B. (2006). Another Look at Measures of Forecast Accuracy. International Journal of Forecasting, 22(4), 679–688.
[3] Guangyu Wu. (2022, September 16). MASE, RMSSE Metrics. Retrieved from https://guangyuwu.wordpress.com/2022/09/16/mase-rmsse-metrics/

